Complete NCERT Solutions Guide
Access step-by-step solutions for all NCERT textbook questions

Welcome to the Chapter 2 - National Income Accounting, Class 12 Macro Economics NCERT Solutions page. Here, we provide detailed question answers for Chapter 2 - National Income Accounting. The page is designed to help students gain a thorough understanding of the concepts related to natural resources, their classification, and sustainable development.
Our solutions explain each answer in a simple and comprehensive way, making it easier for students to grasp key topics National Income Accounting and excel in their exams. By going through these National Income Accounting question answers, you can strengthen your foundation and improve your performance in Class 12 Macro Economics. Whether you’re revising or preparing for tests, this chapter-wise guide will serve as an invaluable resource.
The four factors of production are:
Land – It denotes the natural resources like air, water, soil, etc. The payment that is paid by the firms to acquire these services is called rent.
Labour – It refers to the physical and mental effort required to do a work. For example, engineer, manager, worker, etc. The payment made to the labour in exchange of his/her services are called wages.
Capital – It refers to the monetary investments and physical and tangible investments like machinery, buildings, technology, tools, etc. which assists in the production process. The payment received in exchange of these services is called interest.
Entrepreneur – It refers to the individual who undertakes the risk to organise the production process. Entrepreneurs are the risk takers and often are the innovators of new techniques. They receive profit in exchange for their entrepreneurship. The remunerations paid to the factors of productions are called factor payments or factor incomes. These are the aggregation of rent, wage, interest and profit.
(a) GDPMP = Rs.500 [Barber collects from haircut]
(b) NNPMP = GDP - Depreciation
= 500 - 50
= Rs.450
(c) NNPFC = NNP - Sales tax
= 450 - 30
= Rs.420
(d) PI = NNPFC - Retained earnings
= 420 - 220
= Rs.200
(e) PDI = PI - Income tax
= 200 - 20
= Rs.180
Nominal GNP = Rs.2500
Real GNP = Rs.3000
GNP deflator =
So,
GNP deflator = 83.33%
No, the price level has fallen down by 16.67 % (100 – 83.33) %
Limitations of using GDP as an indicator are as follows:
(i) Nonmonetary exchanges
GDP measures the goods and services produced in an economy during a particular period of time. However, it does not take into account those transactions that do not come under monetary terms. In less developed countries there are non-monetary exchanges, particularly in rural areas. Hence, these transactions remain outside the domain of GDP. The household sector and voluntary sectors get ignored in GDP.
(ii) Inflation
GDP does not take into account the level of prices in a country. Because of inflation, the cost of living increases leading to a decrease in the standard of living. The loss of welfare due to this decrease is not taken into consideration by GDP as an index of welfare.
(iii) Externalities
Increase in the national income is associated with increased levels of pollution, accidents, disasters, shortage and depletion of natural resources, etc. These factors affect human health and lead to ecological degradation. GDP fails to consider the costs or valuations of such factors.
(iv) Income pattern
GDP disregards the income distribution pattern. The increase in aggregate national income may be a result of the increase in income of a few individuals. Thus, this may lead to false interpretation of social welfare.
(v) Welfare
GDP ignores the welfare component as the goods and services produced may or may not add to the welfare of society. For example, the production of goods, like guns narcotic drugs, high-end luxurious goods increase the monetary value of production, but they do not add to the welfare of the majority of the population.
In a sectors economy, consisting of households and firms, the only way in which the households can dispose their income is on the goods and services produced by the firms. The factors of production use their remuneration to purchase goods and services. Thus, the income will come back to the producers in the form of sales revenue. So, there is no difference between the amount that firms distribute in the form of factor payments and consumption expenditure incurred by the households. The same process continues year after year.
However, if there has been any leakage in the form of savings, imports or taxes, then there arises a difference between the aggregate consumption expenditure and aggregate factor payments. In the case of some leakage, the households will spend less than their factors income. Consequently, the firms will receive lesser amounts in the form of revenue, which will reduce the production level and employment level. This process will continue in every successive round and production and employment levels will continue to drop. Thus, the equality between the aggregate consumption expenditure and the aggregate factor payment is very necessary for the smooth functioning of the economy.
| Stock | Flow |
|---|---|
| The variables that are measured at a particular point of time. For example, bank balance as on 1st Oct 2010 is Rs. 5000. | The variables that are measured over an interval of time. For example, interest earned on bank deposits for 1 year, i.e. from 1 Oct-2009 to 30 Sep 2010. |
| It has no time dimensions. | It has time dimensions, like 1 year, 6 months, 10 days, etc. |
| Examples: capital, bank deposits, water in a tank. | Examples: capital formation, interest on capital, water flowing in a stream. |
An example of stock can be the amount or level of water in a tank. At any point of time the amount or the level of water in a tank can be measured. Similarly, the capital is also a stock variable, as the capital can also be measured at any point of time.
Now, if water is flowing out of a tank through a tap, then the level of water will change over time. The difference in water level over an interval of time is an example of a flow variable. Similarly, net investment gives the difference in the investment level over a period of time.
The stock of unsold goods (finished and semi-finished), which a firm carries forward from one year to another year is termed as an inventory. Inventory accumulation can be planned or unplanned. The planned inventory accumulation refers to the inventory that a firm can anticipate or plan. For example, a firm wants to raise its inventory from 1000 to 2000 units of denims and expects sales to be 10000 units. Thereby, it produces 10000 + 1000 units, i.e. 11000 units (in order to raise the inventory by 1000 units). If, at the end of the year it is found that the actual sales that got realised were also 10000, then the firm experiences the rise in its inventory from 1000 to 2000 units. The closing balance of inventory is calculated in the following manner:
Final Inventory = Opening Inventory + Production – Sale
= 1000 + 11000 – 10000
= 2000 units of denims
In this case the inventory accumulation is equal to the expected accumulation. Hence, this is an example of a planned inventory accumulation.
Unplanned inventory accumulation is an unexpected change in an inventory. There is an unplanned accumulation in an inventory when the actual sales are unexpectedly low or high. For example, let us assume, a firm wants to raise inventory from Rs 1000 to 2000 and expects sales to be 10000 and thereby produces 11000 units of denims. If, at the end of the year, the actual sales realised were 9000 units only, which were not anticipated by the firm and therefore the inventory rose by 3000 units. The unexpected inventory accumulation is calculated as:
Final inventory = Opening inventory + Production – Sale
= 1000 + 11000 – 9000
= 3000 units of denims
Hence, this is an example of unexpected inventory accumulation.
The relation between value added and the change in inventory is shown by the given Gross value added by a firm = Sales + change in inventory – Value of intermediate goods.
It implies that, as inventory increases, the value added by a firm will also increase, thus confirming the positive relationship between the two.
GDP can be calculated by the following three methods:
(a) Income method
GDP = Total payments made to the factors of production - (1)
Represents total wages and salaries received by i-th households.
Represents total profit received by i-th households.
Represents total income received by i-th households.
Represents total rent received by i-th households.
Equation (1) can be simplified as
GDP = W + R + I + P
(b) Value added or product method
GDP = sum of gross value added by all firms in an economy
Or GDP = GVA1 + GVA2 + …GVAn
Where
GVA1 represents gross value added by the 1 st firm
GVA2 represents gross value added by the 2 nd firm and so on
.
.
GVAn represents gross value added by the nth firm
Therefore
(c) Expenditure method or final consumption method
GDP Sum total of revenues that firms earn
Or
GDP Total consumption + Investment + Government Consumption expenditure + Net Exports
As households spend some part of their income on imports, some portion of Consumption expenditure also comprises imports, which are denoted by CM. Similarly, some part of the investment expenditure and government consumption expenditure is spent on the foreign investment goods and imports. These portions of investment and Government consumption expenditure is denoted by IM and GM respectively. Thus, the
Final households consumption expenditure, investment expenditure and final Government expenditure that are spent on the domestic firms are denoted by C - CM, I - IM andG – GM respectively.
Substituting these values in the above equation
= C+ I + G + X - M
The three methods give the same result for measuring GDP because what is produced. In the economy is either consumed or invested. The three methods depict the same picture of an economy from three different angles. While the product method presents. The value added or total production, the income method depicts the income earned by all the factors, lastly, the expenditure method presents the expenditure incurred by all the Factors. In the economy, the producer employs four factors of production to produce.
Final goods and earns revenue by sale, which is equivalent to the total value addition by the firm. The firms pay remunerations to the factors, which act as the income of all the factors. These remunerations are equivalent to the factors' contributions to the value addition. These factor incomes are then expended on the goods and services, which verifies the equality between the factor income and expenditure. Hence, the three Methods will always give the same value of GDP.
Budget Deficit
The excess of government expenditure over government income is termed as budget deficit.
Budget Deficit = G - T
Where,
G represents government expenditure
T represents government income
Trade Deficit
Trade deficit measures the excess of import expenditure over the export revenue of a country.
Trade Deficit = M - X
Where,
M represents expenditure on imports
X represents revenue earned by exports
It is given that,
I - S = Rs.2000 crores.
G - T = (-) Rs.1500 crores.
Therefore,
Trade deficit = [I - S] + [G - T]
= 2000 + [-1500]
= Rs.500 crores
National Income (NNPFC) = Rs.850 crores
GDPmp = Rs.1100 crores
Net factor income from abroad = Rs.100 crores
Net indirect taxes = Rs.150 crores
NNPFC = GDPmp + Net factor income from abroad - Depreciation - Net indirect taxes
Putting these values in the formula,
850 = 1100 + 100 - Depreciation - 150
⇒ 850 = 1100 - 50 - Depreciation
⇒ 850 = 1050 - Depreciation
⇒ Depreciation = 1050 - 850 = Rs.200 crores
So, depreciation is Rs.200 crores.
NNPFC = Rs.1900 crores
PDI = Rs.1200 crores
Personal income tax = Rs.600 crores
Value of retained earnings = Rs.200 crores
PDI = NNPFC - Value of retained earnings of firms and government + Value of transfer Payments - Personal tax
⇒ 1200 = 1900 - 200 + Value of transfer payments - 600
⇒ 1200 = 1100 + Value of transfer payments
⇒ Value of transfer payment = 1200 - 1100 = Rs 100 crores
Personal Income = NDPFC + Net factor income from abroad (NFIA) + Transfer Income – Undistributed profit – Corporate tax – Net interest paid by households
NDPFC = Rs.8000 crores
NFIA = Rs.200 crores
Transfer Income = Rs.300 crores
Undistributed profit = Rs.1,000 crores
Corporate tax = Rs.500 crores
Net interest paid by households = Interest paid - Interest received
= 1200 - 1500
= (-) Rs.300 crores
So, putting the values in the above formula
PI = 8000 + 200 + 300 - 1000 - 500 - (- 300)
= 8000 + 200 + 300 - 1000 - 500 + 300
⇒ PI = 7300
So, Personal Income = Rs.7300 crores
Personal Disposable income = Personal Income - Personal Payment
= 7300 - 500
= Rs. 6800 crores
Stay updated with our latest educational content and study tips
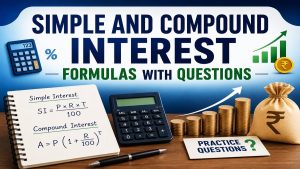
Interest is one of the most significant ideas in maths and financial calculations. It is very common in banking, loan applications, investments, saving account and competitive exams. Simple Interest and Compound Interest make it easier to find out how much more is earned and/or paid on a principal during the period of time. These Interest … Read more
Read More
In 2026, students, professionals, and job seekers must have a high level of spoken English. Spoken English is a beginner level course to enhance learners’ communication skills in English, their pronunciation, vocabulary, grammar structure and confidence in speaking English fluently. Today, the emphasis of spoken English courses is placed on actual conversations, everyday speech practice … Read more
Read More
Artificial Intelligence (AI) and Machine Learning (ML) are two of the most sought-after technologies in today’s digital era. Although these terms are often used together, they are not the same. Machine Learning is, in fact, a component of Artificial Intelligence that enables systems to learn and enhance on their own, without direct programming. AI is … Read more
Read More
Time, Speed, and Distance are some of the most important concepts in mathematics and aptitude. These are the concepts which are used to calculate the speed of an object, time taken for an object to move and the distance traveled during the motion. Questions from this topic are frequently seen in School Tests, Competitive Tests, … Read more
Read MoreExplore more educational resources to enhance your learning journey

Access step-by-step solutions for all NCERT textbook questions

Practice with latest CBSE sample papers for all classes

Quick reference guide for all important mathematical formulas

Complete multiplication tables with tips and tricks

Discover proven study methods that help students excel in board examinations.

Complete guide to career options and decision-making after completing Class 12.

Learn scientific methods to improve memory and retention for better academic performance.
Join thousands of students who have improved their academic performance with our comprehensive study resources.