Complete NCERT Solutions Guide
Access step-by-step solutions for all NCERT textbook questions

Welcome to the Chapter 4 - Analysis of Financial Statement, Class 12 Accountancy - Company Accounts and Analysis of Financial Statements NCERT Solutions page. Here, we provide detailed question answers for Chapter 4 - Analysis of Financial Statement. The page is designed to help students gain a thorough understanding of the concepts related to natural resources, their classification, and sustainable development.
Our solutions explain each answer in a simple and comprehensive way, making it easier for students to grasp key topics Analysis of Financial Statement and excel in their exams. By going through these Analysis of Financial Statement question answers, you can strengthen your foundation and improve your performance in Class 12 Accountancy - Company Accounts and Analysis of Financial Statements. Whether you’re revising or preparing for tests, this chapter-wise guide will serve as an invaluable resource.
(a)Trend analysis
(b)Common-size financial analysis
(c)Financial ratio analysis
(d)Cost volume profit analysis
(e)Benchmarking (industry) analysis
In Horizontal Financial Analysis, the comparison is made between an item of
financial statement, with that of the base years corresponding item. On the other hand, in Vertical Financial Analysis, an item of the financial statement is
compared with the common item of the same accounting period.
Analysis and Interpretation refers to a systematic and critical examination of
the financial statements. It not only establishes cause and e Tect relationship
among the various items of the financial statements but also presents the
financial data in a proper manner. The main purpose of Analysis and
Interpretation is to present the financial data in such a manner that is easily
understandable and self-explanatory. This not only helps the accounting users to
assess the fi nancial performance of the business over a period of time but also
enables them in decision making and policy and financial designing process.
Financial Analysis has great importance to various accounting users on
various matters:
1. It helps in evaluating the profit earning capacity and financial feasibility of a business.
2. It helps in assessing the long-term solvency of the business.
53. Many business owners and company managers have found that insight gained from their examination of company financial statements can be invaluable. Such insight can help businesses improve their profitability, cash flow, and value.
A comparative statement is a document used to compare a particular financial statement with prior period statements. Previous financials are presented alongside the latest figures in side-by-side columns, enabling investors to identify trends, track a companys progress and compare it with industry rivals.
A common size income statement is an income statement in which each line
item is expressed as a percentage of the value of revenue or sales. Common size
financial statements help to analyze and compare a companys performance over several periods with varying sales figures.
Tools of Financial Analysis
1. Comparative Statements: Such statements are the statements showing the
profitability and financial position of a firm for different periods of time in a comparative form to get an idea about the position of the firm in two or more
periods. Firms and companies apply this with regard to only 2 financial statements viz. Balance Sheet and Income Statement. Hence, they prepare these 2 financial statements in the comparative form. Noteworthy, the firms need to use the same accounting principles to get a better result.
2. Common Size Statement: These are the statements which indicate the
relationship of different items of a financial statement with some common item
by showing each item as a percentage of the common item. It enables the firms to do the inter-firm as well as an intra-firm comparison which is almost impossible in case of comparative statements. Hence, it is also known as ‘Vertical analysis‘. Its purpose is to study the key changes and trends in the financial position.
3. Trend Analysis: It is a technique of studying the operational results and financial position over a series of years. Using the previous years’ data, a business enterprise does trend analysis to observe the percentage changes over time for the selected data. Trend analysis is important for the business because it points at the basic changes in the nature of the business. By looking at a trend in the particular ratio, firms may find whether the ratio is falling, rising or remaining constant. After due observation, relevant steps can be taken.
4. Ratio Analysis: Ratio analysis is a process of analyzing and reviewing the
company’s financial statement and performance. It is a quantitative analysis in
which many factors of company financial performance is evaluated. Like solvency ratios, debt management ratios, liquidity, market value ratio, asset management ratio, profitability, etc. As a technique of financial analysis, accounting ratios measure the comparative importance of the individual items of the income and position statements. Hence, it helps to assess the profitability, solvency, and efficiency of an enterprise.
5. Cash Flow Analysis: It refers to the analysis of the actual movement of cash int and out of the organization. The flow of cash into the business is called as cash inflow and the flow of cash out of the firm is called as cash outflow or negative cash flow.
Hence, by preparing the cash flow statement, the firm is able to find out the various reason behind the inflow and outflow of the cash.
Limitations of Financial Analysis: Although there are many advantages of the financial statements, there are certain disadvantages of the same. As the analysis is done on the basis of data provided in the financial statements which can be incorrect. Hence, it is necessary for the firms to consider in mind various limitations as well.
1. While doing the financial analysis, firms often fail to consider the price changes. When firms compare data from various time periods, they do it without providing the index to the figures. Hence, the firm does not show the inflation impact.
2. Intangible assets not recorded. Firms do not record many intangible assets. Instead, any expenditure made to create an intangible asset are immediately
charged to expense.
3. Firms consider only the monetary aspects of the financial statements. They do
not consider the non-monetary aspect.
4. Firms prepare the financial statements on the basis of on-going concept, as
such, it does not reflect the current position.
5. The statements do not necessarily provide any value in predicting what will
happen in the future.
1) Trend percentages, also referred to as index numbers, help you to compare financial information over time to a base year or period. You can calculate trend percentages by: Compute the percentages by Analysis year amount / base year amount and then multiplying the result by 100 to get a percentage.
2) Trend analysis tries to predict a trend, such as a bull market run, and ride that
trend until data suggests a trend reversal, such as a bull-to-bear market. Trend
analysis is helpful because moving with trends, and not against them, will lead to profit for an investor.
3) Trend analysis can improve your business by helping you identify areas with your organisation that are doing well, as well as areas that are not doing well. In
this way it provides valuable evidence to help inform better decision making
around your longer-term strategy as well as ways to futureproof your business.
4) Trends are an opportunity to do something new not just from an individual
standpoint, but on a macro level. Trends allow us to shift cultural currents and
ultimately depict an underlying intuition.
The following are the importance of Comparative Statements.
(i) Make Presentation Simpler : Comparative statements presents the financial
data in a simpler form. On the other hand, an year-wise data of the same items
are presented side-byside, which not only makes the presentation clear but also
enables easy comparisons (both intra-firm and inter-firm) conclusive.
(ii) Help in Drawing Conclusion: The presentation of comparative statement is so
effective that it helps the analyst to draw conclusion quickly and easily and that
too without any ambiguity.
(iii) Help in Forecasting :The management may analyse the trend and forecast
and draft various future plans and policy measures, with the help of comparative
statement:
(iv) Help in Detection of Problems :The comparative analysis not only enables the management in locating the problems but also helps them to put various
budgetary controls and corrective measures to check whether the current
performance is aligned with that of the ” planned targets. With the help of the
comparison of the financial data of two or more years, the financial management
can easily detect the problems.
Financial statement analysis is the process of analyzing a companys financial statements for decision-making purposes. External stakeholders use it to understand the overall health of an organization as well as to evaluate financial performance and business value. Interpretation is making the numerical data (numbers) speak. Giving importance to language spoken by the numbers and providing appropriate and sufficient is useful during performance measure. Importance:
1) It provides internal and external stakeholders with the opportunity to make
informed decisions regarding investing. Financial statement analysis also provides lending institutions with an unbiased view of a business's financial health, which is helpful for making lending decisions.
2) Data interpretation is very important, as it helps to acquire useful information
from a pool of irrelevant ones while making informed decisions. It is found useful
for individuals, businesses, and researchers.
3) Analysis and interpretation of financial statements are an attempt to determine the significance and meaning of the financial statement data so that a forecast may be made of the prospects for future earnings, ability to pay interest, debt maturities, both current as well as long term, and profitability of sound.
4) Wrong and defective decisions are taken by the top management in the
absence of analysis and interpretation.
5) Sometimes, hasty and intuitive decisions are also taken by the various
responsible executives.
6) Everybody has limited experience in business activities. Hence, one can easily understand the complexities of business activities through analysis and
interpretation.
7) If any decision is taken on the basis of intuition or conclusion derived, there is
no meaning in decision and nobody understand the decision. In other words, if
the decisions are based on scientific analysis and interpretation, everybody
understand the decision very easily.
8) Analysis and interpretation are necessary to verify and examine the correctness and accuracy of the decisions already taken on the basis of intuition.
Common size statements can be classified into two broad categories
(i) Common Size Income Statements
(ii) Common Size Balance Sheet
Common Size Statement is prepared in a columnar form for analysis. In a Common Size Statement, each item of the financial statements is compared to a common item. The analyses based on these statements are commonly known as Vertical Analysis. The following are the columns prepared in a Common Size Statement
(a) Particulars Column:This column shows the various financial items under their respective heads.
(b) Amount Columns :These columns depict the amount of each item, sub-totals and the gross total of a particular year.
(c) Percentage or Ratio Columns :These columns show the proportion of each item to the common item either in terms of percentage or ratio. The Common Size Statements can be presented in the following two ways. Method 1 Percentage column is shown beside the amount column of the year to which percentage column belongs.
Method 2 Amount columns are shown first and their percentage columns are shown after the amount columns.
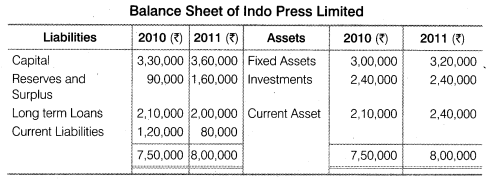
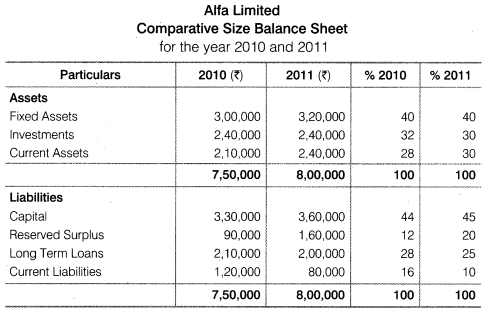
Example :From the following information provided by Alfa Limited Prepare the Common Size Statements.
Stay updated with our latest educational content and study tips

Interest is one of the most significant ideas in maths and financial calculations. It is very common in banking, loan applications, investments, saving account and competitive exams. Simple Interest and Compound Interest make it easier to find out how much more is earned and/or paid on a principal during the period of time. These Interest … Read more
Read More
In 2026, students, professionals, and job seekers must have a high level of spoken English. Spoken English is a beginner level course to enhance learners’ communication skills in English, their pronunciation, vocabulary, grammar structure and confidence in speaking English fluently. Today, the emphasis of spoken English courses is placed on actual conversations, everyday speech practice … Read more
Read More
Artificial Intelligence (AI) and Machine Learning (ML) are two of the most sought-after technologies in today’s digital era. Although these terms are often used together, they are not the same. Machine Learning is, in fact, a component of Artificial Intelligence that enables systems to learn and enhance on their own, without direct programming. AI is … Read more
Read More
Time, Speed, and Distance are some of the most important concepts in mathematics and aptitude. These are the concepts which are used to calculate the speed of an object, time taken for an object to move and the distance traveled during the motion. Questions from this topic are frequently seen in School Tests, Competitive Tests, … Read more
Read MoreExplore more educational resources to enhance your learning journey

Access step-by-step solutions for all NCERT textbook questions

Practice with latest CBSE sample papers for all classes

Quick reference guide for all important mathematical formulas

Complete multiplication tables with tips and tricks

Discover proven study methods that help students excel in board examinations.

Complete guide to career options and decision-making after completing Class 12.

Learn scientific methods to improve memory and retention for better academic performance.
Join thousands of students who have improved their academic performance with our comprehensive study resources.